

.svg)



Get better insight into your return data
The larger your business grows, the more important it becomes to base decisions on accurate data — including for returns. Use return insights to improve the customer journey and reduce return costs.
.png.avif)
“Every 1 percent decrease in the return rate roughly results in a 1.5 percent jump in our net result.”
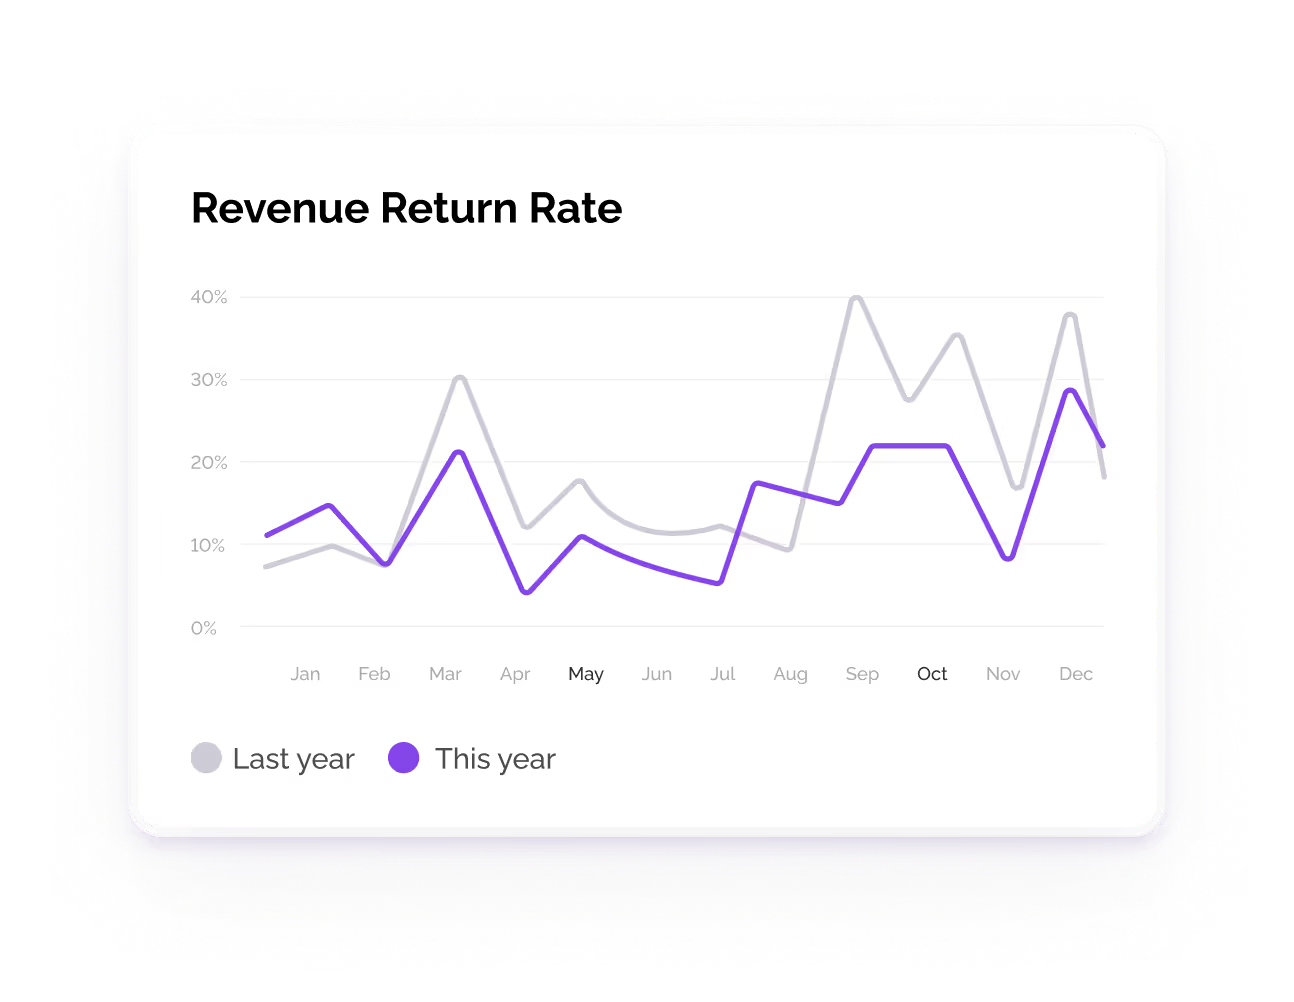
The results our merchants achieve with better return insights
When you have access to accurate return data in a clear dashboard, you can make better decisions. Those decisions lead to fewer returns and lower return costs.
Decrease in return rate
Exchange rate
Store credit conversion
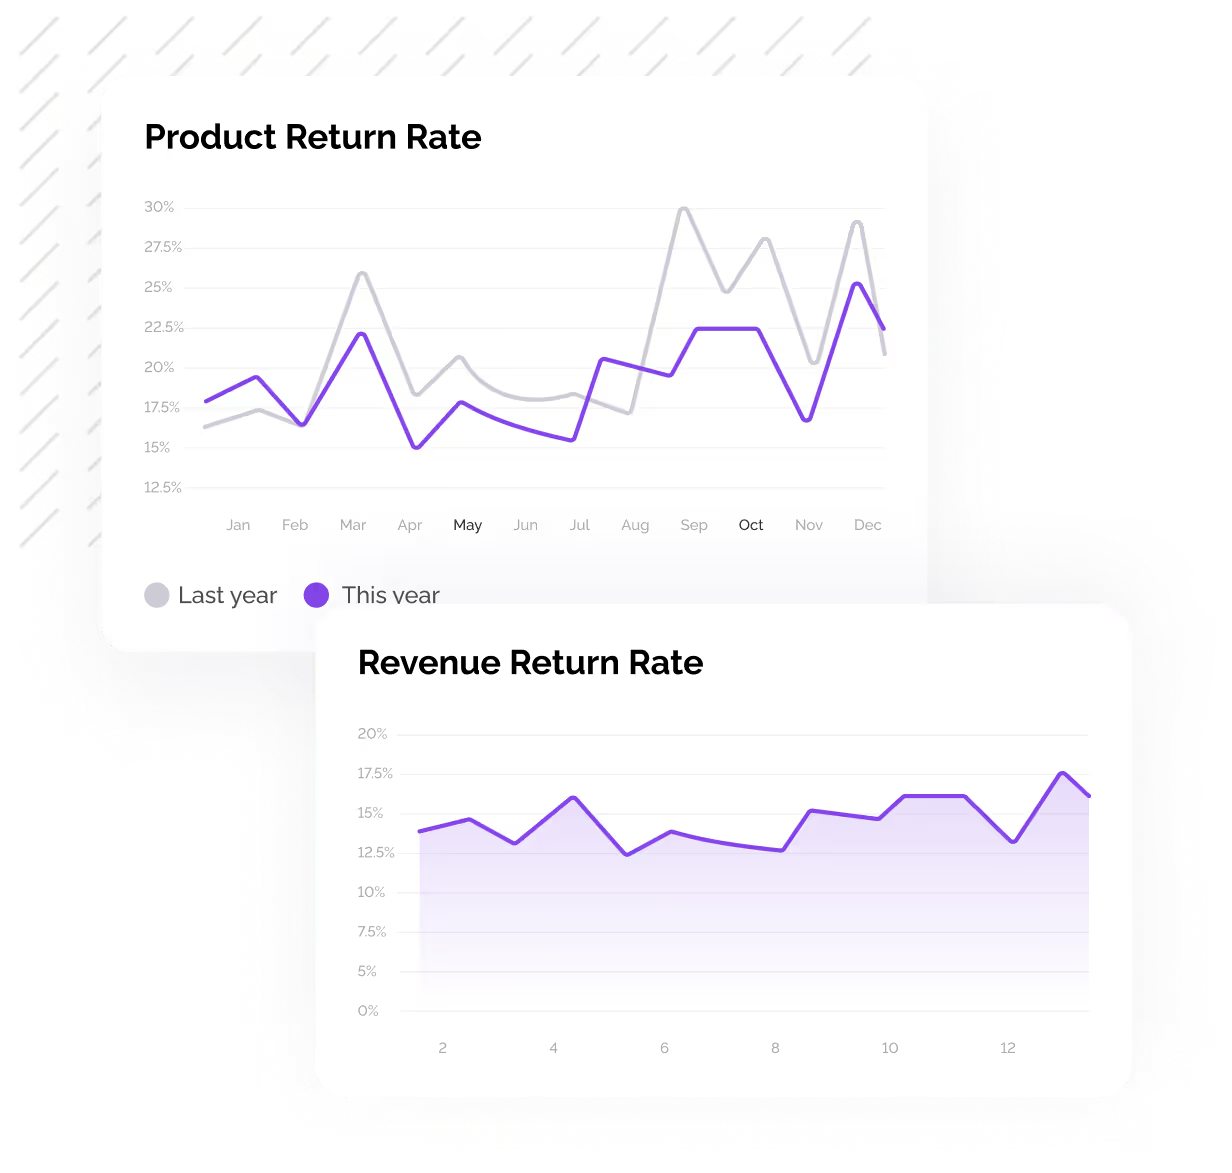
Understand your return performance at a glance
With Returnista’s return dashboard, you track both product- and revenue-level return rates, identify trends based on historical comparisons, and take action quickly when performance declines.
Identify root causes with detailed product-level insights
See exactly which products have the greatest impact on your returns. For each high-impact SKU, you gain insight into the underlying return reasons. This enables you to reduce return volumes based on data.

Reduce revenue loss across payment methods, exchanges, and store credit
See exactly which payment methods drive higher return rates, how often returns are converted into exchanges, and how often customers choose store credit over refunds. Use these insights to adjust your return strategy.


Even more ways to gain insights into returns
Explore the additional features below that give you access to accurate insights into return and exchange behaviour.

Return rate dashboard
Get an instant overview of your return performance, including return rates and other key return metrics.

Product Return Impact Index
Understand the impact of returns on your revenue at SKU level. Useful for improving your product assortment and customer journey.
Store credit insights
Use these insights to optimise your messaging, UX and incentives, and improve store credit adoption compared to refunds.
Exchange insights
Use these insights to act when products are frequently returned but rarely exchanged.
Reduce return costs with accurate return insights
Use detailed return insights to improve the customer journey and reduce your return costs. Make data-driven decisions with Returnista.
Schedule a Demo